Simulating the sun
The centerpiece of neonsee technology is custom tailored steady-state solar simulation. Our core competency is the ability to integrate novel measurement technology and data processing in intuitive, highly accessible systems. Our variable optical set-up is ready to not only meet, but go beyond the most challenging standards in the photovoltaic, automotive and aerospace industry. Unique features enable our customers to perform extraordinary applications, while staying fully compliant with their specific requirements. In the area of solar cell research and development, we are able to offer our customers industry leading solar cell performance analysis realized within one single instrument.
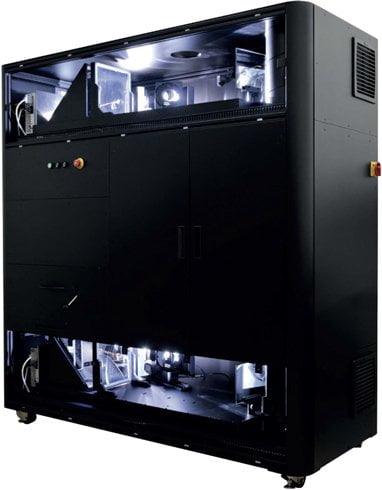
neonsee sun simulation core technology
Key features
- Steady-state Xenon light source
- Optional flash mode with short exposure time
- Single source lighting field up to 30 cm x 30 cm
- Maximum illuminated area 85 cm x 85 cm
- Spectrum: AM0, AM1.5G/D or custom tailored
- Spectral range up to 250 – 2000 nm
- Dynamically adjustable spectral wavelength zones
- 0.05 – 1.3 solar constants irradiance range
- Uniformity of irradiance and spectrum ±1.5 – 2 %
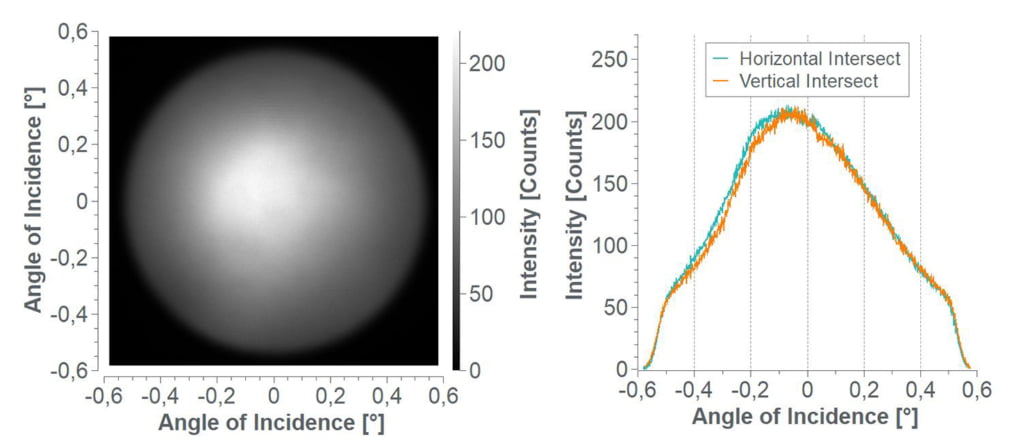
- Beam divergence: ±0.55° for AM0
- Long term temporal stability: ±2 %
- Standard and fully custom tailored models available
- CE certified safe and reliable operation
neonsee bifacial solar simulation system for solar cell analysis
| Optical properties | |
|---|---|
| Illuminated area | 50×50 – 300×300 mm² |
| Light source | Xenon Short Arc / light emitting plasma |
| Operating mode | Continuous |
| Lamp lifetime | > 1000h (Xe) / > 25000 h (LEP) |
| Short-Term instability of irradiance (IEC 60904-9, ASTM E 927) | 0.5 % (Class A) |
| Long-Term instability of irradiance (IEC 60904-9, ASTM E 927) | 0.5 % (Class A) |
| Non-unifomity of irradiance (IEC 60904-9, ASTM E 927) | 0.5 % (Class A) |
| Solar simulator | |
| Spectrum (IEC 606904-3, ASTM G 173) | AM1.5G, AM1.5D, or customized |
| Spectral distribution (IEC 60904-9, ASTM E 927) | Class A |
| Range of light intensity | 0 – 1200 W/m2 (continuously variable) |
| Collimation | Up to ± 0,3° |
| Concentration | 1 – 500x (with reduced area) |
| Remote controllability | |
| Irradiance | |
| Lamp on/off | |
| Lamp status | |
| Lamp voltage monitor | |
| Lamp current monitor | |
| Lamp temperature monitor | |
| Safety interlock | |
| General information | |
| Power supply | 1 Ph, 110/230VAC, 47-63 Hz |
| Wattage | Model dependent |
| Conformity | CE |
| Warranty | 1 year, upgradeable to 3 years |
Full range intensity control
Similar to the sun that changes its irradiance and spectrum depending on time (day, season, years) and position (earth, moon, deep space), neonsee solar simulators offer full brightness and spectral control. Step-less irradiance control adapts anything from low light to high intensity conditions thus enabling intensity level dependent characterization of the device under test.
Advantages & Applications
- 0 – 100% brightness control
- Continuous and automated re-calibration
- Excellent short and long term stability
- Highly reproducible test conditions
- Linearity measurements
- Advanced solar cell analysis
- Thermal balance characterization
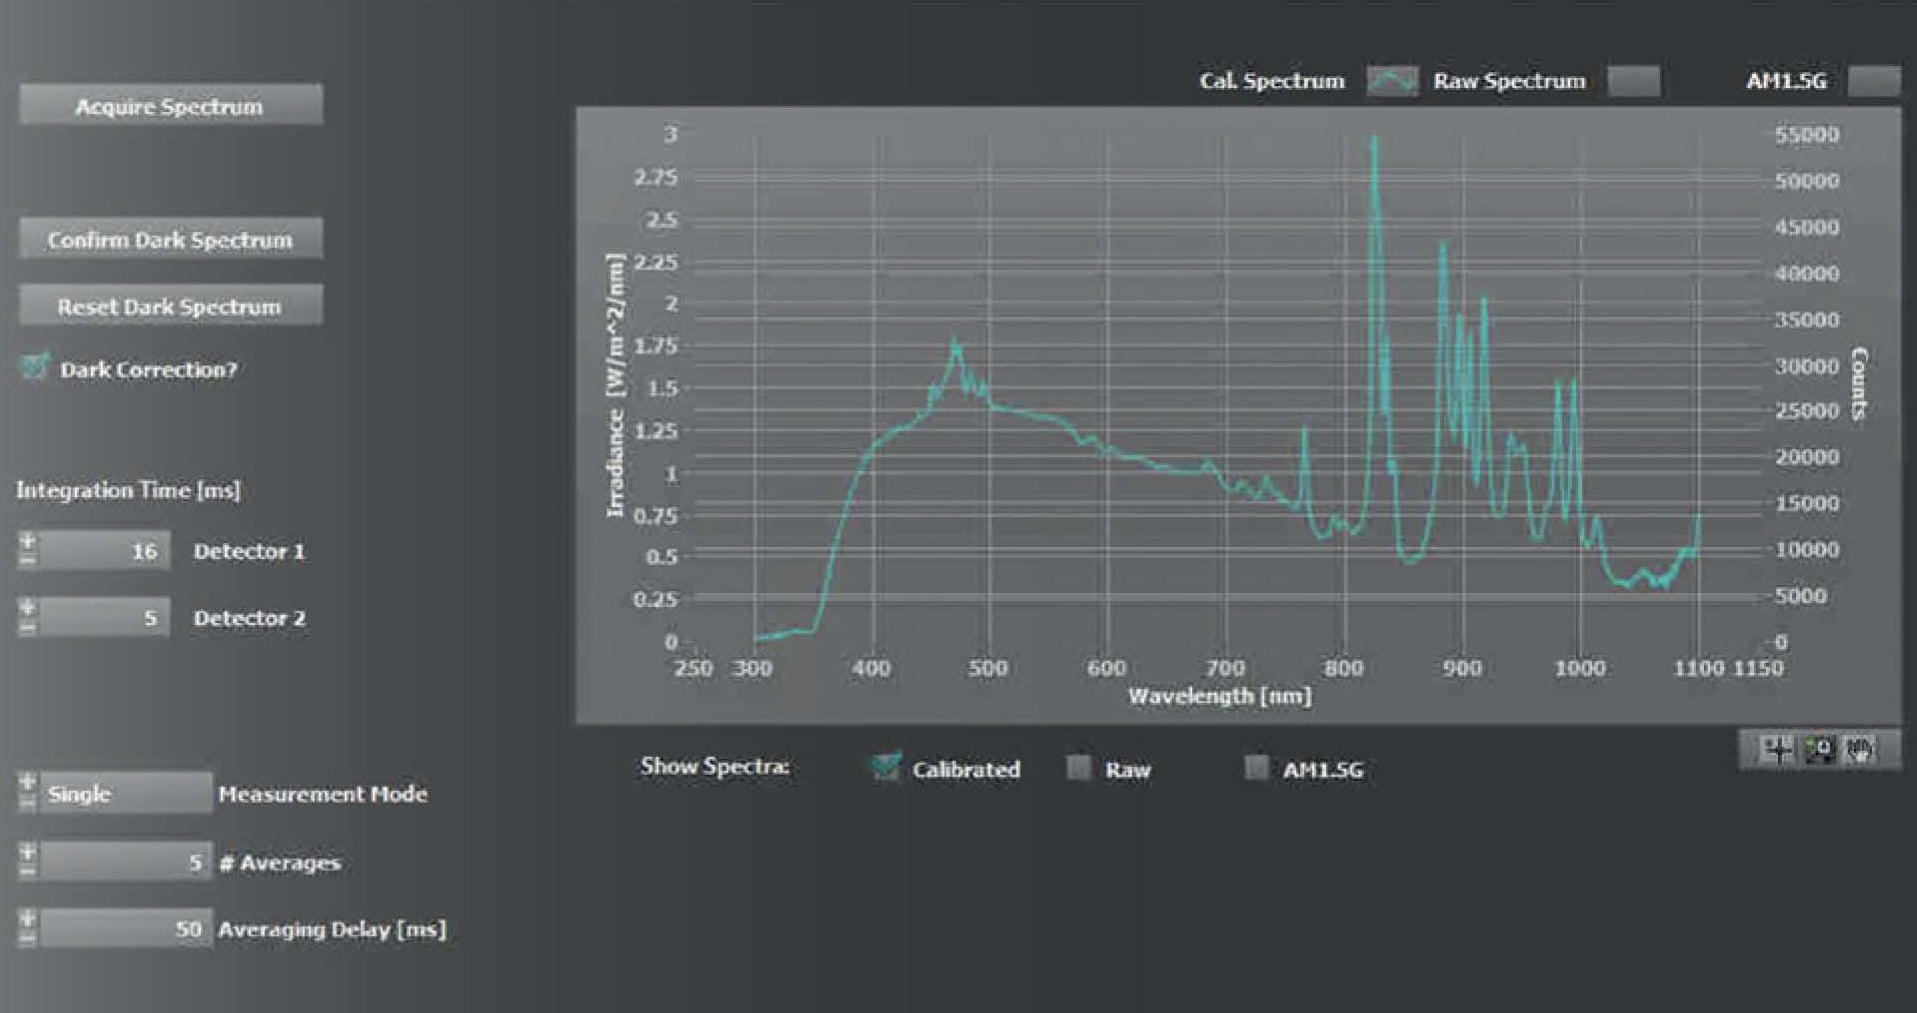
Full irradiance control with neonsee solar simulation software
Spectral adaptability
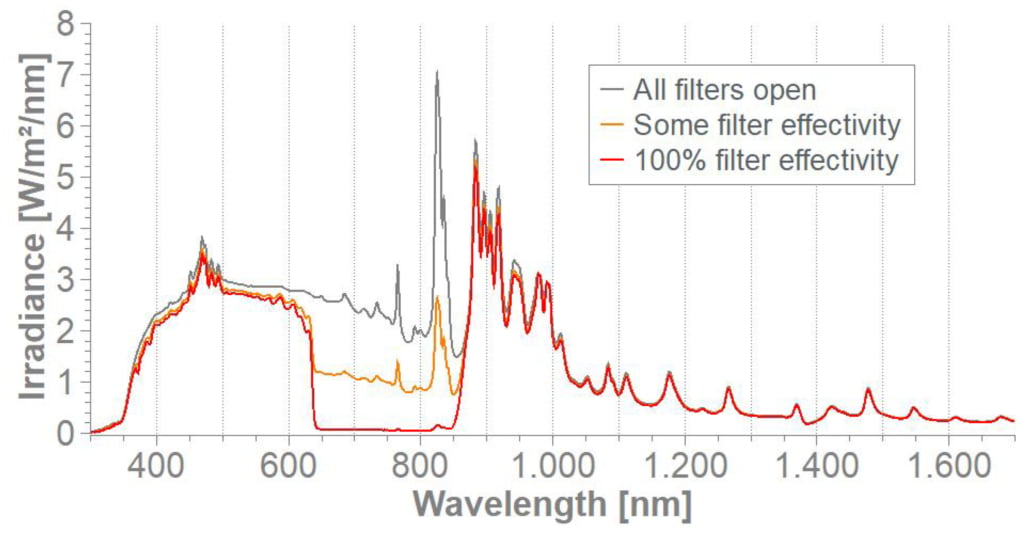
Accurate spectral characterization of test subjects like multi-junction PV devices or spacecraft components can be a challenging task. neonsee solar simulation optical design is based on a single xenon steady-state light source with up to ten individually tunable spectral wavelength zones. Spectral ranges and behavior are custom tailored to meet the individual requirements of our customers technologies. The irradiance in each wavelength zone is optionally monitored by a dedicated sensor, permitting automatic re-calibration routines for stable and reproducible long term operation.
Spectral tuning options
- Coverage of 2-10 spectral zones
- Individually and continuously adjustable
- Custom tailored wavelength zones
- 250 – 2000 nm spectral range
- Non-uniformity < ±2% in all zones
- Dedicated zonal irradiance monitoring
- Automated re-calibration routines
Spectral measurement: Example of middle wavelength filter, filter rejection band: 640 – 860 nm, filter efficiency continuously adjustable, negligible cross talk into other wavelength regions
Collimation
Thanks to the smart optical design of neonsee sun simulators it is possible to achieve ultra high beam collimation like it is required for testing of spacecraft instruments and other specialty components like concentration photovoltaic assemblies (CPV) or the hot-spot evaluation of automotive headlights. Only properly collimated light beams can be highly concentrated (focused) and stay widely unaffected by distance variations from the calibration plane.
Advantages & Applications
- Customized collimation upon request
- Light beam can be focused
- Less disturbing shading effects
- Fewer measurement errors with distance
- Reduced calibration effort
- Concentrator photovoltaic measurement
- Advanced sun sensor characterization
- Hot-spot evaluation
- Aerospace navigation instruments
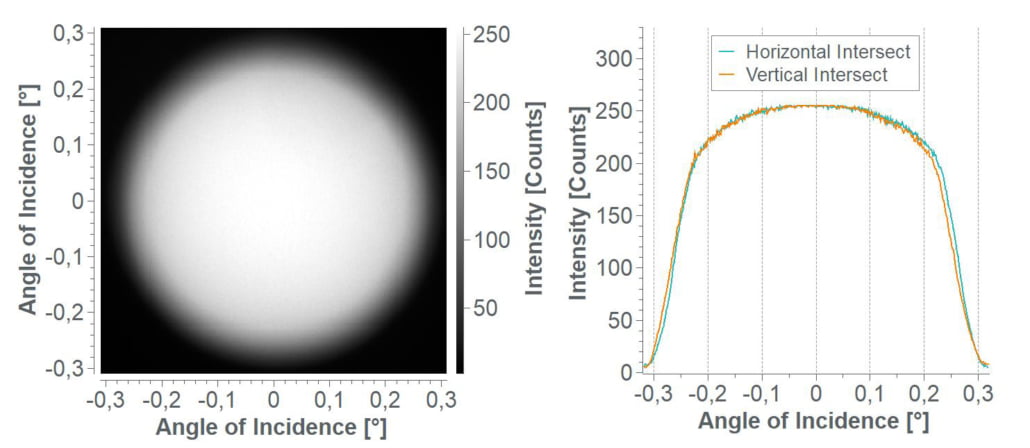
Calibration measurement: the real sun, beam divergence approx. ± 0.267°, depends on sun – earth distance etc. (day, season, years).
Example measurement: 21 x 21cm² illumination area under 1SC AM0, beam divergence approx. ± 0.55° – custom shape and range available on request
Spatial Uniformity
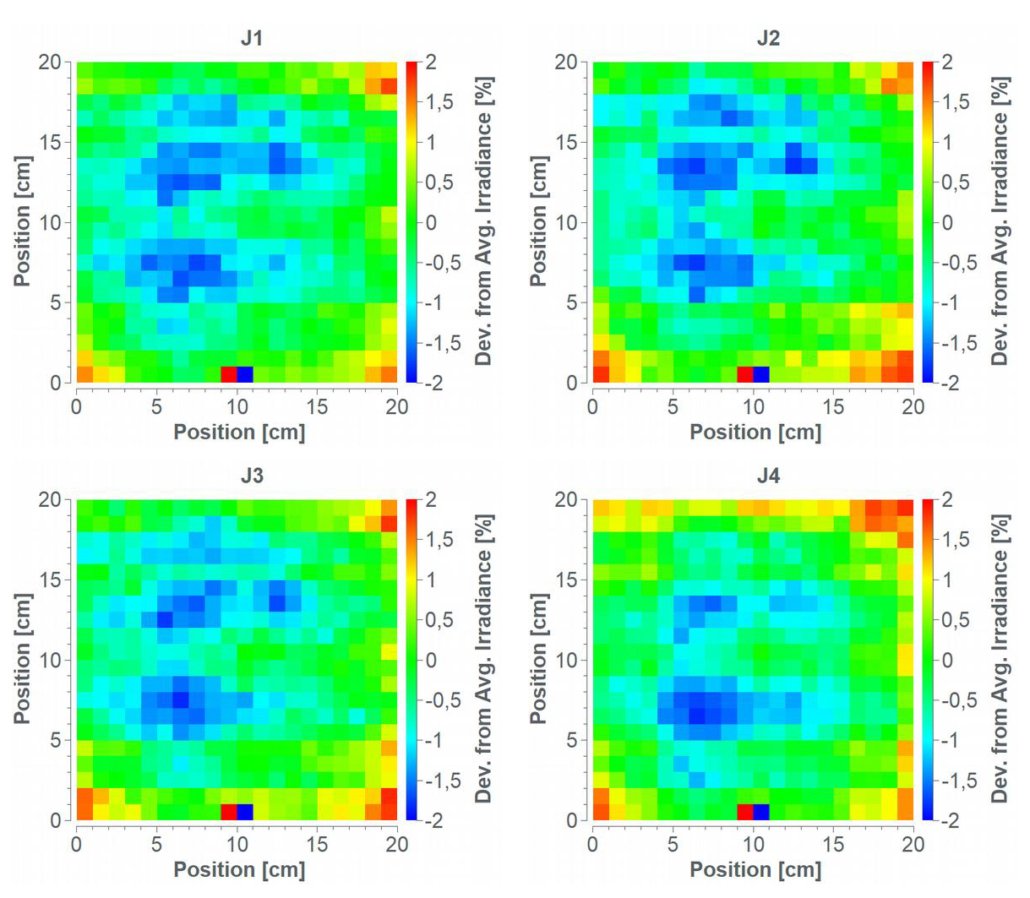
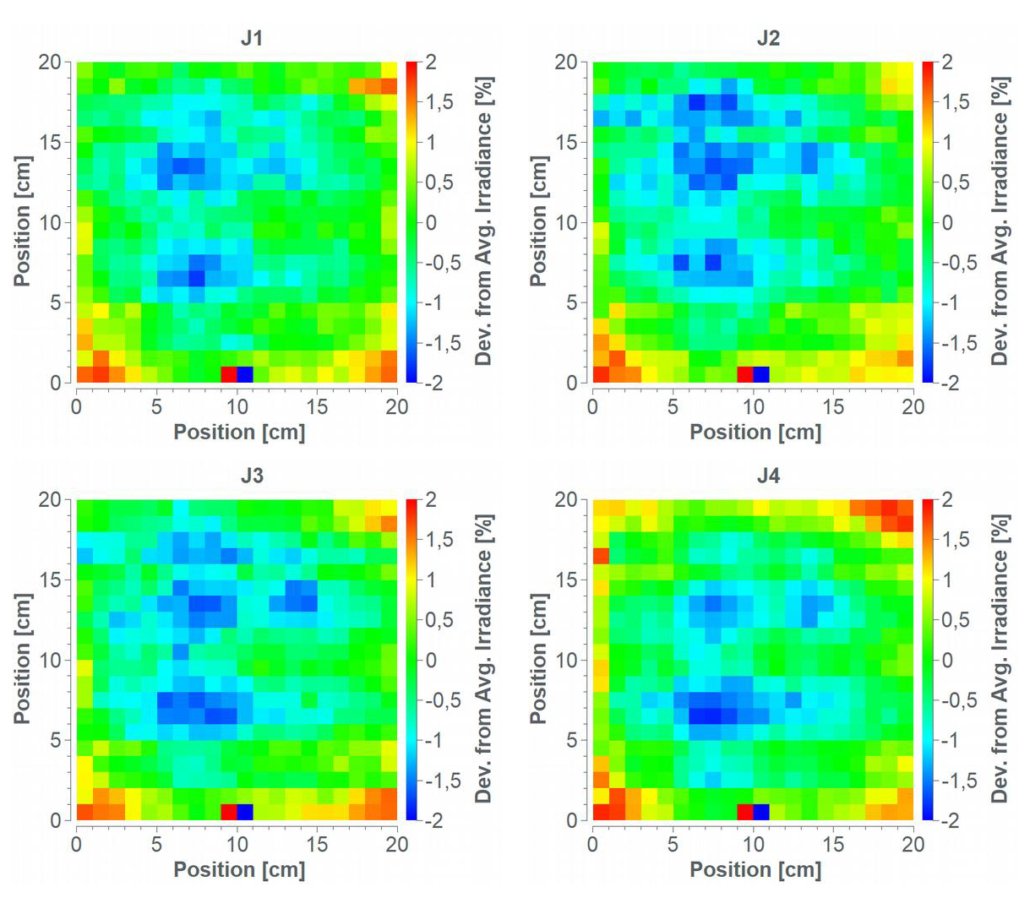
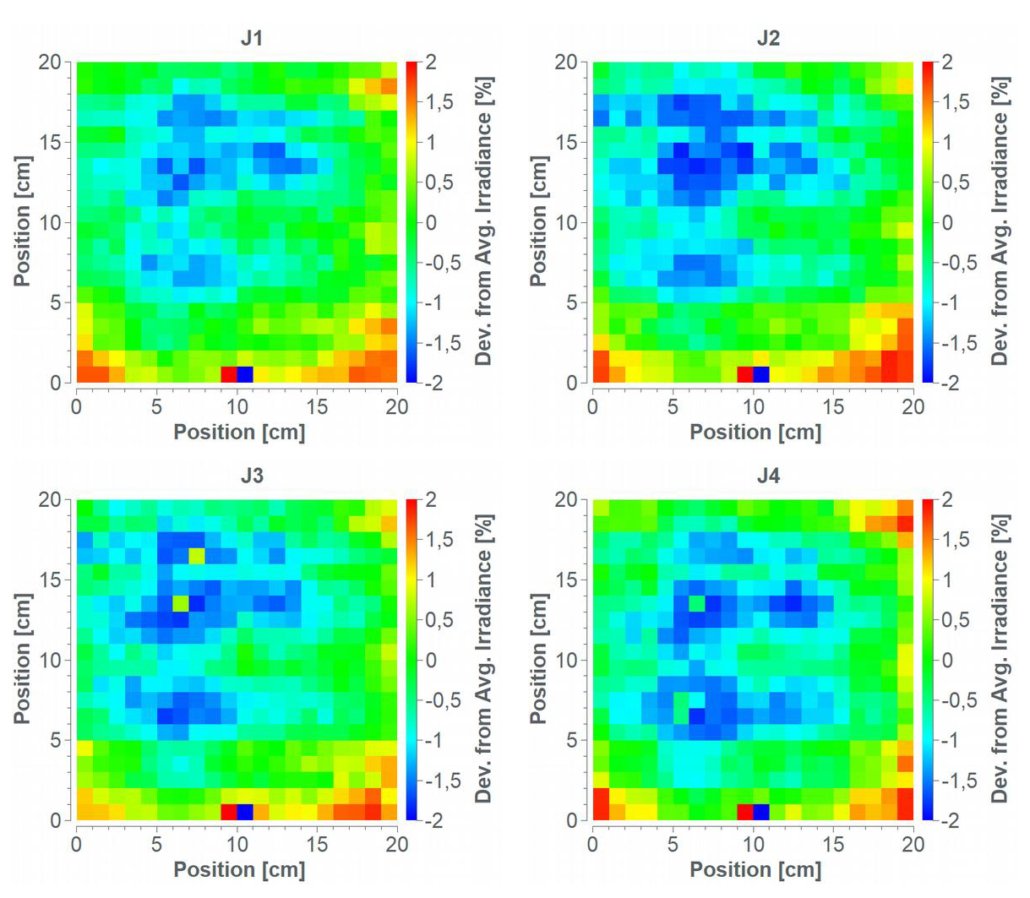
Our unique optical design allows for stable irradiance uniformity across your entire test object or solar cell sample. Spatial homogeneity is not affected when tuning the irradiance and / or spectrum of our instruments for a wide range of application scenarios. With spectra from AM1.5G over AM1.5D to AM0 and irradiance levels from 50 – 1500 W/sqm (up to 500x concentration by use of low beam divergence focusing optics) our technology is ready to meet your requirements. Below data shows an example measurement on an area of 20 x 20 cm² under AM0 class A spectrum and three varying irradiance levels (0.8SC, 1SC, 1.2SC). The data points have been acquired with a calibrated set of four component cells (J1-J4) from a multi-juntion solar cell design with spectral range from 300 – 2000 nm.
Spatial Uniformity Results @ 0.8 SC AM0
Spatial uniformity results at 0.8 SC AM0
Spatial Uniformity Results @ 1.0 SC AM0
Spatial uniformity results at 1.0 SC AM0
Spacial Uniformity Results @ 1.2 SC AM0
Spatial uniformity results at 1.2 SC AM0
Irradiance Stability
- Irradiance continuously measured for 44h
- Fully automated recalibration
- Overall temporal stability better than ±2%
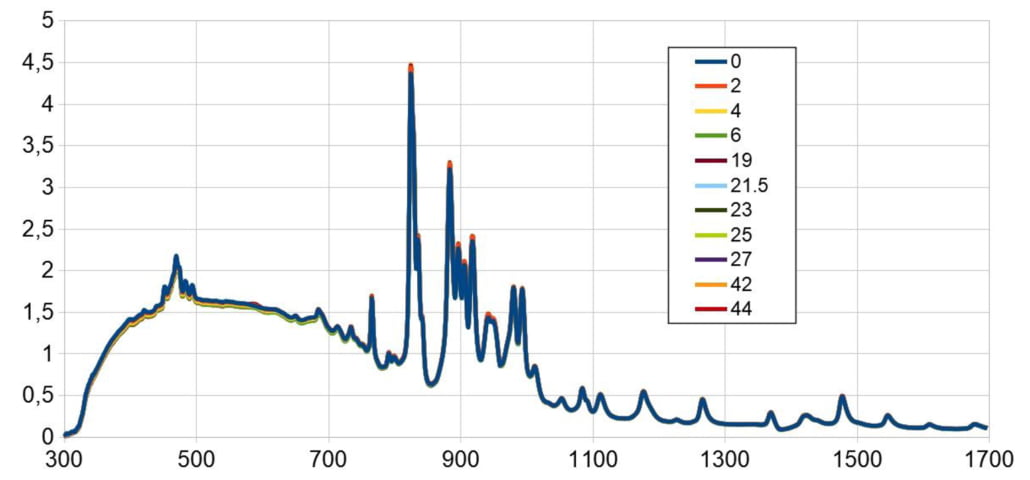
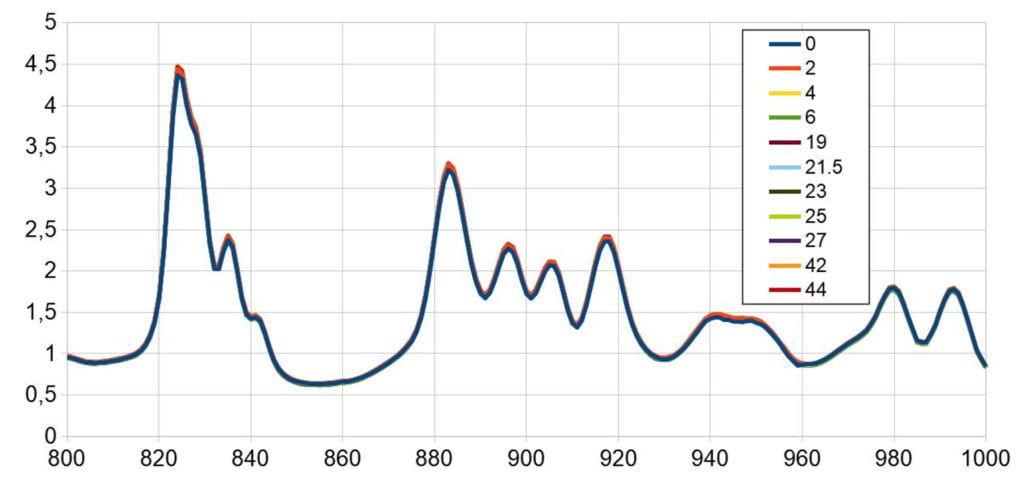
Long term measurement for irradiance and spectrum.
Spectral Stability
- Spectrum continoulsy measured for 44h
- Fully automated recalibration
- Negligible effect on spectral mismatch


